1 Introduction
This article refers to the address: http://
Automobile pollution is one of the most important issues that people are most concerned about and urgently need to solve. As an important method for detecting automobile exhaust pollutants, the simple transient working condition method (VMAS method, IG method) can count the total discharge quality, monitor the real emission situation of the vehicle, the equipment cost is not high, the measurement is relatively accurate, and the new vehicle certification The detection results are related, and a series of advantages such as NO-related factors can be detected, which has become a hot topic of research. The VMAS (Vehicle Mass Analysis System) detection method has a good application basis in the United States and Europe. At present, the flow analyzer of the VMAS test system applied in China is basically imported, especially the products of the US sensors company. The product is not only expensive, maintenance and repair is very inconvenient, and it is not conducive to complete secondary development with a complete test system composed of chassis dynamometer and gas analyzer. To this end, we conducted research on flow analyzers to reduce equipment costs and promote localization of products.
2, the flow analyzer works
The structure of the VMAS test system is shown in Figure 1.
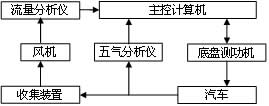
Figure 1 VMAS test system composition
The car runs on the chassis dynamometer according to the specific working conditions required by the national standard. The chassis dynamometer simulates the acceleration inertia of the vehicle under different working conditions and the transient working load of the road. The original exhaust gas of the car directly enters the high through the sampling probe. Accurate five-gas analyzer analyzes the concentration values ​​of CO, CO2, HC, NOX, and O2 in exhaust emissions. At the same time, all the other exhaust gas passes through the collecting device, is diluted by the surrounding air, and then sent to the flow analyzer under the action of the fan to measure the volume flow of the dilution gas, and the volume flow measurement value is sent to the main control computer, and the five gas analyzer The gas concentration analysis results and the driving speed and mileage of the chassis dynamometer are also sent to the main control computer. The computer calculates the total amount of harmful gases CO, CO2, HC and NOX in the vehicle exhaust according to the gas concentration, volume, dilution ratio, speed and time. Emissions (g/km). Where the dilution ratio Dil is based on the oxygen concentration in the air ![]() Oxygen concentration of the mixture
Oxygen concentration of the mixture ![]() And the oxygen concentration in the original exhaust gas of the car
And the oxygen concentration in the original exhaust gas of the car ![]() Calculated according to Equation 1.
Calculated according to Equation 1.
![]() (1)
(1)
3. Structure design of flow analyzer
The universal vortex flow meter is unable to be installed on the gas flow analyzer due to its large body and complicated structure. In order to meet the requirements of use, the new design idea is adopted, and the triangular column vortex generator and piezoelectric vortex detection probe are adopted. It is directly mounted on the sampling tube of the gas flow analyzer and is designed in an integrated structure to make the structure more compact.
The overall structure of the flow analyzer is shown in Figure 2. The total length of the sampling tube is 800mm. According to the flow range of the gas during operation, the inner diameter D of the flow analyzer is determined to be 100mm. The installation position of each sensor is shown in the figure.
1-Oxygen Concentration Sensor 2 - Pressure Sampling Hole 3 - Triangular Column Vortex
4-piezoelectric vortex detection probe 5-temperature sensor
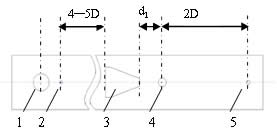
Figure 2 Overall structure of the flow analyzer
Selecting the triangular column vortex generator, the vortex signal generated by this generator is strong, because the vortex is fixed at its boundary layer separation point, so the Strohal number is relatively constant, about S1=0.16, vortex street The linear relationship between frequency and flow is good. The triangular column is installed vertically in the gas pipeline. When the gas bypasses the spoiler column, the boundary layer separation occurs. The vortex is alternately generated on the left and right sides of the spoiler column. According to the Karman vortex theory, the relationship between the vortex frequency and the flow velocity is obtained. for ![]() , where: the width of the bottom edge of the d-triangle column, taken as 28 mm; u-fluid flow rate. According to the D and d values, the parameters L1, L2 and θ of the triangular prism are determined, as shown in Fig. 3.
, where: the width of the bottom edge of the d-triangle column, taken as 28 mm; u-fluid flow rate. According to the D and d values, the parameters L1, L2 and θ of the triangular prism are determined, as shown in Fig. 3.
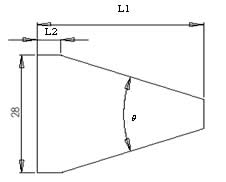
Figure 3 Structure of the triangular column (unit: mm)
Formula based on Reynolds number ![]() , where: ν - the kinematic viscosity of air, at 20 ° C under standard pressure,
, where: ν - the kinematic viscosity of air, at 20 ° C under standard pressure, ![]() The Reynolds number corresponding to the flow range of 140m3/h~930m3/h is 3.3~21.9×10⁴, which meets the upper and lower limits of vortex measurement and has an ideal meter factor. The theoretical calculation meter factor K is:
The Reynolds number corresponding to the flow range of 140m3/h~930m3/h is 3.3~21.9×10⁴, which meets the upper and lower limits of vortex measurement and has an ideal meter factor. The theoretical calculation meter factor K is:
![]() (3)
(3)
S1 and S2 are the cross-sectional area of ​​the pipeline and the windward area of ​​the triangular prism, respectively. The final meter factor shall be based on the results of the calibration experiment.
4, the circuit design of the flow analyzer
The circuit design of the flow analyzer includes four types of sensors: flow sensor, oxygen concentration sensor, temperature sensor and pressure sensor. The circuit block diagram is shown in Figure 4.
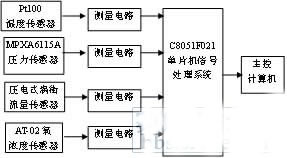
Figure 4 block diagram of the flow analyzer
3.1 Flow sensor
The piezoelectric detecting vortex method, when the gas flows through the pipeline, the vortex generated by the triangular prism periodically exerts a force on the piezoelectric ceramic of the probe to generate a periodically changing electric charge, and then passes through the charge amplifying circuit. The step-by-step filtering and shaping are converted into corresponding square wave voltage pulses with a frequency of 44 Hz to 297 Hz and an amplitude of about 8.8V. The signal is optically isolated, on the one hand, it can suppress the interference from the test site. On the other hand, the amplitude will be below 5V and sent to the MCU for periodic measurement. Since the frequency of the vortex street is proportional to the gas flow rate, the gas volume flow rate is measured by measuring the frequency (period) of the voltage pulse.
The circuit structure of the vortex flow sensor is shown in Figure 5.
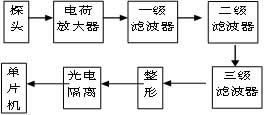
Figure 5 vortex flowmeter circuit block diagram
3.2 Oxygen sensor
Adopting A-02/T type oxygen concentration sensor, the product is designed according to PTB 18.10, mainly for automobile exhaust gas measurement. In a dry environment, when the oxygen concentration changes from 0 to 100%, the output analog voltage signal is 7 ~ 13.5 mV, the response time is less than 5 seconds, the linearity error is <0.5%, the working pressure range is 75~125kPa, and there is NTC temperature compensation. . The signal is amplified by the measuring circuit, and the zero point adjustment and gain adjustment are performed, so that the output voltage of the circuit is 0~2.40V, and the corresponding oxygen concentration is 0~22.5%.
3.3 Temperature sensor
Pt100 platinum resistance is used as the temperature sensing element, and it is integrated with the metal protection tube and the insulating material to reduce the performance of the platinum resistance by harmful gases and impurities in the mixture. In order to improve the temperature measurement accuracy, multi-point calibration was carried out, and a piecewise linearization method was adopted in the software. At the same time, in order to improve the anti-interference ability of the sensor, a three-wire circuit structure is adopted. The temperature measurement accuracy of the sensor is actually better than 1.0 °C in the range of (5~150) °C.
3.4 Pressure sensor
The pressure measurement uses the MPXA6115A series of on-chip integrated silicon pressure sensor. The sensor integrates a bipolar operational amplifier circuit and a thin film resistor network circuit. The internal structure is shown in Figure 6.
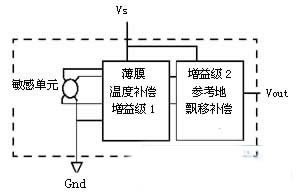
Figure 6 Internal structure of the MPXA6115A
After testing, the output voltage signal of the sensor has a very good linear relationship with the input gas pressure. When the absolute pressure of the input gas changes within the range of 15 kPa to 115 kPa, the maximum relative error is not more than 1%.
3.5 Data Processing System
The C8051F021 single-chip microcomputer is used as the data processing core to complete the collection and processing of temperature, pressure, flow and oxygen concentration signals. The C8051F021 microcontroller integrates a multi-channel 12-bit successive approximation ADC converter with a conversion rate of 100kps. The internal voltage reference generator generates a 2.4V high-precision reference voltage with a temperature coefficient of 15×10-6/°C. The output of temperature, pressure and oxygen concentration sensor is adjusted to 0~2.40V voltage signal after zero point adjustment and gain adjustment, and enters the single-chip microcomputer for AD conversion. The accuracy of AD conversion is 0.025%.
The output of the flow sensor is a square wave voltage pulse of 44 Hz to 297 Hz. For the signal of this frequency range, the measurement period is adopted, which is more convenient and more accurate. The counter TIME0 is selected for counting and periodic measurement is performed. One-twelfth of the main frequency of 22.1184MHz is used as the counting pulse, the 16-bit counter has a counting error of ±1, and the uncertainty of the period measurement is about two ten thousandths.
The single-chip microcomputer calibrates the data and period measurement values ​​of the three-way AD conversion, converts them into corresponding temperature, pressure, oxygen concentration and flow value, and transmits them to the main control computer through the serial port. In the control computer, the communication program and man-machine interface program of the computer and the single-chip computer are written in VB language, and the measurement parameters are displayed and saved, and the interface is left, and the data can be compared with the control program of the five-gas analyzer and the chassis dynamometer. Exchange, complete the calculation of the final emissions of the car.
5. Experiments and conclusions
In order to verify the measurement accuracy of the flow analyzer, the flow sensor's flow, temperature, pressure, and oxygen concentration are separately calibrated and comprehensively evaluated. Among them, the temperature measurement accuracy is ±1°C, the pressure measurement accuracy is better than 1%, and the oxygen concentration measurement accuracy is better than 0.5%, which fully meets the requirements of national standards for test instruments.
Due to the large number of experimental projects, this paper only gives the calibration experimental methods and data of the main sensor vortex flow sensor.
The gas flow analyzer was installed on a pipe with a diameter of 100 mm for calibration experiments. The LXH series critical flow sonic nozzle gas flow standard device was used as the flow standard. The gas flow in the air passage was adjusted by selecting different combinations of 12 sonic nozzles. In the measurement range of 140m3 / h to 930m3 / h, select 5 calibration points, the experimental data are shown in Table 1.
Table 1 Flow calibration experimental data
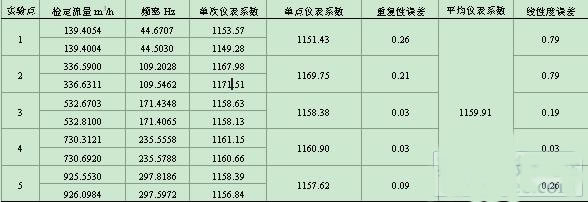
As seen from Table 1, the flow meter has an average meter system of 1159.91 and a basic error of 0.93%. Through the calibration experiment of the flow sensor in the flow analyzer, we can see that the deviation of the flow measurement does not exceed 1%, compared with 5% of the similar products produced by American Sensors, the accuracy is greatly improved, and the cost is greatly increased. Reduced, suitable for large-scale promotion and use in China.
references
[1] State Environmental Protection Administration, General Administration of Quality Supervision, Inspection and Quarantine, National Standard of the People's Republic of China GB18285-2005, emission limit and measurement method for exhaust pollutants of ignited engines (double idle method and simple working condition method) [M ], China Environmental Press, 2005
[2] Wu Dake. Design and Research of Intelligent Vortex Flowmeter [D], Chongqing: Southwest Agricultural University, 2003
[3] Jia Yunfei, Zhang Tao, Xing Juan, Simulation of flow field and characteristics of vortex flow sensor based on FLUENT[J], Journal of System Simulation, 19 (12), 2007: 2683-2689
[4] Wang Xiaofen, Xu Kejun, Chen Zhiyuan, DSP-based low-cost vortex flowmeter signal processing system[J], Journal of Instrument and Instrument, 27(11), 2006: 1427-1432
[5] Wang Chao, Jiang Yinping, Zhang Tao, Research on high-precision intelligent vortex flow transmitter[J], Journal of Instrument and Instrument, 21(4), 2000:357-363
[6] Ge Yunshan, Yang Zhiqiang, Zhang Xuemin, etc. Study on the test method of transient operating conditions in gasoline vehicles [J]. Automotive Engineering, 29(3), 2007: 212-215
Stator and rotor laminations are an important part of motors and generators. The stator and rotor laminations are made of electrical steel by cutting and stamping. Usually the laminations are circular, and for those large motors or generators, the laminations are fan-shaped. Usually the thickness of the stator and rotor laminations is 0.2mm, 0.35mm, 0.5mm, 0.65mm, but depending on the application, there are thinner or thicker laminations. We are able to produce motors of various sizes from 100mm to 1250mm outer diameter. For larger motors or generators, we can also produce stator segment laminations.
Customizable Stator laminations,Customizable Rotor laminations,Segmented Stator laminations,Premanent Magent Rotor Lamination
Henan Yongrong Power Co., Ltd , https://www.hnyongrongglobal.com