1 Introduction
In 2002, Berson et al. [1] discovered a novel cell on the retina that has a strong association with the regulation of human biological rhythms. To put it simply, when light enters the human eye, all the way is a visual sensitization system that is responsible for the traditional cone and rod cells, and transmits the received signal to the visual cortex of the brain through the optic nerve to form a visual experience. The other is the circadian nucleus (SCN), which is transmitted by the autonomic photoreceptor retinal ganglion cells (ipRGC) to the brain, and the SCN is controlled by the pineal gland that controls the secretion of certain hormones in the body. Connected, thereby achieving regulation of circadian rhythms and control of hormone secretion. Lighting has expanded into the field of non-visual biological effects. The classification and functional research of ipRGC has made many important advances with the rapid development of molecular biology and genetics [2]. The relationship between light and health is increasingly being Find.
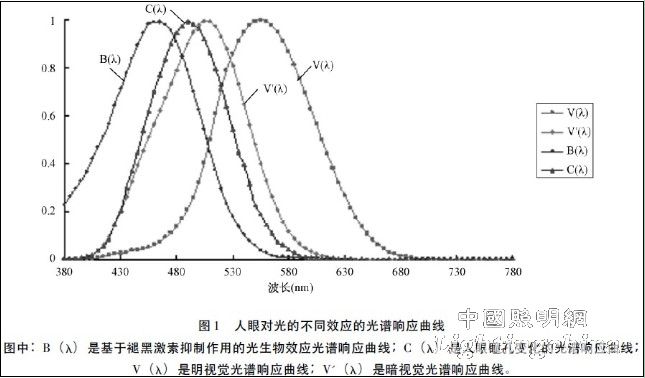
At present, more and more researchers are investing in non-visual biological effects: Yasukouchi [3] studies have shown that illumination color temperature has a significant effect on photobiological effects; Cajochen [4] studies show that short-wavelength illumination can cause long-wavelength illumination The effects of body temperature and heart rate change are more significant; Van Bommel [5] uses the relative value of the source spectrum to estimate the photobiological effect of the source based on the relative value of the incandescent lamp spectrum; Qi Wenqiang et al [6] pointed out that the blue light is non-visual to brain cognition. The regulation effect is the largest; Home Qi [7] establishes the spectral response digital model of photobiological effect by measuring the changes of physiological parameters such as heart rate, body temperature and blood pressure with specific intensity and spectral illumination, which provides a reference for practical lighting design work. . Numerous studies have shown that the most obvious effect on non-visual biological effects is concentrated in the short-wave region. As shown in Figure 1, the B ( λ ) curve is based on melatonin secretion and the C ( λ ) curve is based on pupil size changes. It is drawn with V' (λ) and V (λ), and their peak wavelengths are 464nm, 491nm, 507nm and 555nm.
Christian Cajochen et al. at Basel University in Switzerland [4] used different wavelengths of light to illuminate the human eye and monitored physiological parameters such as central rate, body temperature, and melatonin levels. The results showed that the human body temperature increased after irradiation with light of 460 nm; the use of 550 nm light and no use of any light did not have any significant effect on human body temperature. Similarly, light with a wavelength of 460 nm caused an increase in heart rate after 1.5 hours of exposure; while 550 nm and complete darkness had no effect on human heart rate. Ishibash [8] passes different ambient temperatures (21 ° C, 28 ° C and 35 ° C, relative humidity 50%), different color temperatures (3000K, 5000K and 7500K) and different noise environments (background noise is + 0dB, + 5dB and +10dB) In the case of 8 subjects, physiological parameters were tested. The results show that the ambient temperature has the most obvious effect on the human heart rate. In the absence of background noise, the ratio of low frequency power to high frequency power in heart rate variability at 7500K color temperature is significantly higher than 5000K and 3000K. Tsutsumi [9] illuminates the human eye at different time intervals by installing fluorescent lamps of different color temperatures in the bedroom and living room, while monitoring the heart rate variability and blood pressure of 8 subjects, and the results show that the 6700K light source is suitable for heart rate variability and blood pressure. Fluorescent lamps with significantly higher impact than 3000K and 5000K.
From these studies, it can be found that light in the short-wavelength band (such as wavelength 460nm) is more likely to cause changes in heart rate than long-wavelength bands (such as 550nm). The effect of high color temperature light source on heart rate is more obvious than that of low color temperature light source. The two models of non-visual biological effects that have been recognized internationally so far are basically consistent. However, these two models with theoretical basis and scientific value also have their own defects and shortcomings in practice: Based on the experimental method of melatonin secretion inhibition, there is a time difference due to the inhibition of causality between light and melatonin. Sexuality will increase the complexity of experimental development and verification; experimental methods based on pupil contraction have strong intuitiveness and immediacy, but can not rule out traditional photoreceptor cells (cone and rod cells) under illumination The effect on pupil contraction. Therefore, using more experimental data and better experimental methods will help people unravel all kinds of uncertainties.
Moore et al [10] found that SCN participates in autonomic regulation of the human body through the subparaventricular zone (SPVZ), the hypothalamus and the retrochiasmatic area (RCA), the brainstem. As one of the characteristics of human autonomous mediation, the generation of heart rate changes is mainly the result of fine regulation of sympathetic and vagus nerves in the sinus node of the heart [11], while the parasympathetic nerve fibers in the vagus nerve are emitted by the parasympathetic nucleus in the brainstem. Out. This may be the neural pathway that affects the body's heart rate changes.
In this paper, a single-color LED is used as the illumination source. The heart rate and its rate of change are used to compare and analyze the photobiological effects of different spectral environments on the human body under low illumination.
2 experiment settings
The experiment uses four high-quality monochrome LEDs as experimental light sources, and controls the luminous intensity of the LED light sources through a DC source to achieve dimming and calibration. In the experiment, four kinds of monochromatic light of blue, green, yellow and red as shown in Fig. 2 were selected as the experimental light environment. The values ​​of the main wavelength and color coordinates of the monochrome LED are shown in Table 1.